
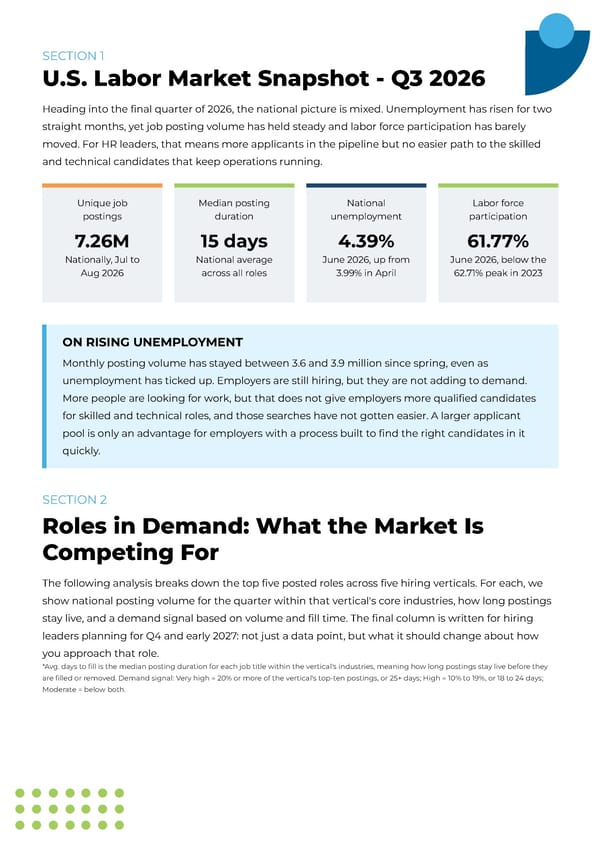
SECTION 1 U.S. Labor Market Snapshot - Q3 2026 Heading into the final quarter of 2026, the national picture is mixed. Unemployment has risen for two straight months, yet job posting volume has held steady and labor force participation has barely moved. For HR leaders, that means more applicants in the pipeline but no easier path to the skilled and technical candidates that keep operations running. Unique job postings 7.26M Nationally, Jul to Aug 2026 Median posting duration 15 days National average across all roles National unemployment 4.39% June 2026, up from 3.99% in April Labor force participation 61.77% June 2026, below the 62.71% peak in 2023 ON RISING UNEMPLOYMENT Monthly posting volume has stayed between 3.6 and 3.9 million since spring, even as unemployment has ticked up. Employers are still hiring, but they are not adding to demand. More people are looking for work, but that does not give employers more qualified candidates for skilled and technical roles, and those searches have not gotten easier. A larger applicant pool is only an advantage for employers with a process built to find the right candidates in it quickly. SECTION 2 Roles in Demand: What the Market Is Competing For The following analysis breaks down the top five posted roles across five hiring verticals. For each, we show national posting volume for the quarter within that vertical's core industries, how long postings stay live, and a demand signal based on volume and fill time. The final column is written for hiring leaders planning for Q4 and early 2027: not just a data point, but what it should change about how you approach that role. *Avg. days to fill is the median posting duration for each job title within the vertical's industries, meaning how long postings stay live before they are filled or removed. Demand signal: Very high = 20% or more of the vertical's top-ten postings, or 25+ days; High = 10% to 19%, or 18 to 24 days; Moderate = below both.
 Eastridge Quarterly Talent Intelligence - Q3 2026 Page 2 Page 4