
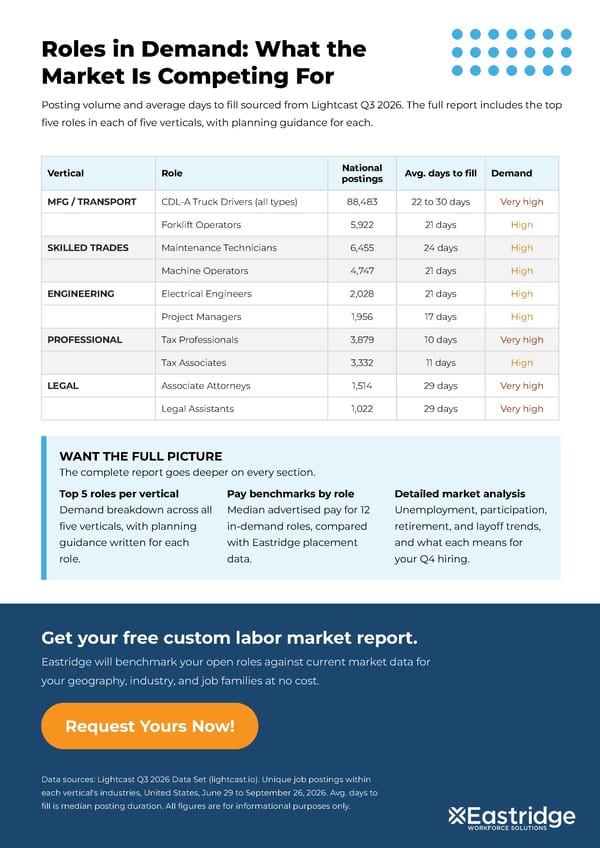
Roles in Demand: What the Market Is Competing For Posting volume and average days to fill sourced from Lightcast Q3 2026. The full report includes the top five roles in each of five verticals, with planning guidance for each. Vertical Role National postings Avg. days to fill Demand MFG / TRANSPORT CDL-A Truck Drivers (all types) 88,483 22 to 30 days Very high Forklift Operators 5,922 21 days High SKILLED TRADES Maintenance Technicians 6,455 24 days High Machine Operators 4,747 21 days High ENGINEERING Electrical Engineers 2,028 21 days High Project Managers 1,956 17 days High PROFESSIONAL Tax Professionals 3,879 10 days Very high Tax Associates 3,332 11 days High LEGAL Associate Attorneys 1,514 29 days Very high Legal Assistants 1,022 29 days Very high WANT THE FULL PICTURE The complete report goes deeper on every section. Top 5 roles per vertical Demand breakdown across all five verticals, with planning guidance written for each role. Pay benchmarks by role Median advertised pay for 12 in-demand roles, compared with Eastridge placement data. Detailed market analysis Unemployment, participation, retirement, and layoff trends, and what each means for your Q4 hiring. Get your free custom labor market report. Eastridge will benchmark your open roles against current market data for your geography, industry, and job families at no cost. Request Yours Now! Data sources: Lightcast Q3 2026 Data Set (lightcast.io). Unique job postings within each vertical's industries, United States, June 29 to September 26, 2026. Avg. days to fill is median posting duration. All figures are for informational purposes only.
 Quarterly Talent Intelligence Report - Q3 2026 Page 1