
Workforce Insights: San Diego, CA
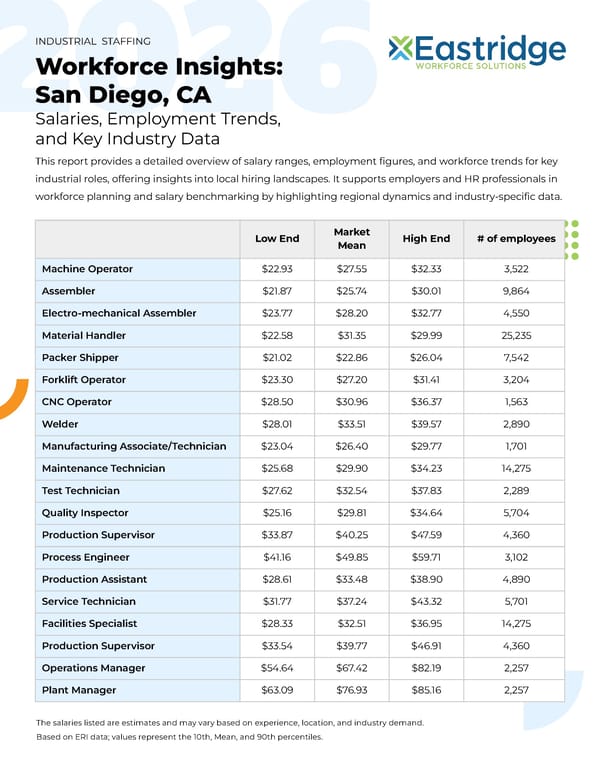
This report provides an overview of salary ranges, employment trends, and workforce data for industrial roles in San Diego, highlighting local hiring conditions and salary benchmarks.
Low End Market Mean High End # of employees Machine Operator $22.93 $27.55 $32.33 3,522 Assembler $21.87 $25.74 $30.01 9,864 Electro-mechanical Assembler $23.77 $28.20 $32.77 4,550 Material Handler $22.58 $31.35 $29.99 25,235 Packer Shipper $21.02 $22.86 $26.04 7,542 Forklift Operator $23.30 $27.20 $31.41 3,204 CNC Operator $28.50 $30.96 $36.37 1,563 Welder $28.01 $33.51 $39.57 2,890 Manufacturing Associate/Technician $23.04 $26.40 $29.77 1,701 Maintenance Technician $25.68 $29.90 $34.23 14,275 Test Technician $27.62 $32.54 $37.83 2,289 Quality Inspector $25.16 $29.81 $34.64 5,704 Production Supervisor $33.87 $40.25 $47.59 4,360 Process Engineer $41.16 $49.85 $59.71 3,102 Production Assistant $28.61 $33.48 $38.90 4,890 Service Technician $31.77 $37.24 $43.32 5,701 Facilities Specialist $28.33 $32.51 $36.95 14,275 Production Supervisor $33.54 $39.77 $46.91 4,360 Operations Manager $54.64 $67.42 $82.19 2,257 Plant Manager $63.09 $76.93 $85.16 2,257 The salaries listed are estimates and may vary based on experience, location, and industry demand. Based on ERI data; values represent the 10th, Mean, and 90th percentiles. 2026 This report provides a detailed overview of salary ranges, employment figures, and workforce trends for key industrial roles, offering insights into local hiring landscapes. It supports employers and HR professionals in workforce planning and salary benchmarking by highlighting regional dynamics and industry-specific data. INDUSTRIAL STAFFING Workforce Insights: San Diego, CA Salaries, Employment Trends, and Key Industry Data
 Workforce Insights: San Diego, CA Page 2