
Workforce Insights: San Diego, CA
This report provides an in-depth analysis of salary ranges, employment figures, and workforce trends for key industrial roles in San Diego, providing valuable insights for workforce planning and salary benchmarking.
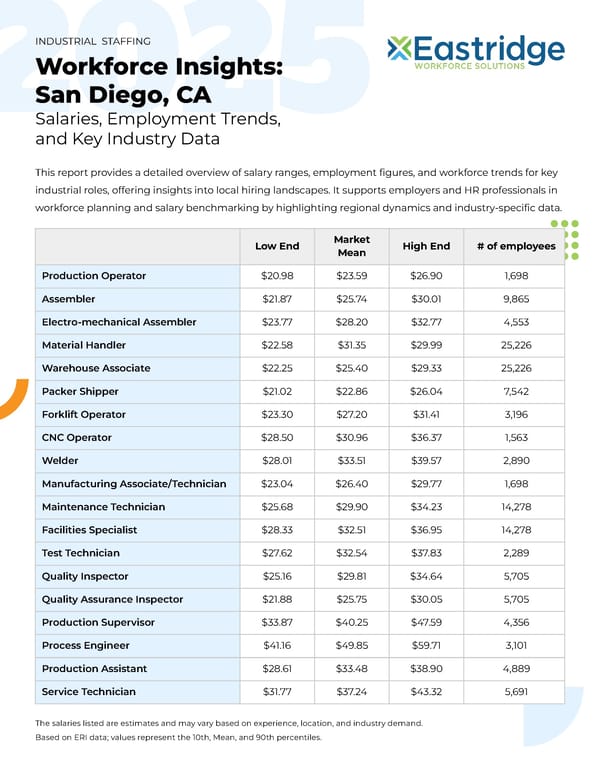
2025 This report provides a detailed overview of salary ranges, employment figures, and workforce trends for key industrial roles, offering insights into local hiring landscapes. It supports employers and HR professionals in workforce planning and salary benchmarking by highlighting regional dynamics and industry-specific data. INDUSTRIAL STAFFING Workforce Insights: San Diego, CA Salaries, Employment Trends, and Key Industry Data Low End Market Mean High End # of employees Production Operator $20.98 $23.59 $26.90 1,698 Assembler $21.87 $25.74 $30.01 9,865 Electro-mechanical Assembler $23.77 $28.20 $32.77 4,553 Material Handler $22.58 $31.35 $29.99 25,226 Warehouse Associate $22.25 $25.40 $29.33 25,226 Packer Shipper $21.02 $22.86 $26.04 7,542 Forklift Operator $23.30 $27.20 $31.41 3,196 CNC Operator $28.50 $30.96 $36.37 1,563 Welder $28.01 $33.51 $39.57 2,890 Manufacturing Associate/Technician $23.04 $26.40 $29.77 1,698 Maintenance Technician $25.68 $29.90 $34.23 14,278 Facilities Specialist $28.33 $32.51 $36.95 14,278 Test Technician $27.62 $32.54 $37.83 2,289 Quality Inspector $25.16 $29.81 $34.64 5,705 Quality Assurance Inspector $21.88 $25.75 $30.05 5,705 Production Supervisor $33.87 $40.25 $47.59 4,356 Process Engineer $41.16 $49.85 $59.71 3,101 Production Assistant $28.61 $33.48 $38.90 4,889 Service Technician $31.77 $37.24 $43.32 5,691 The salaries listed are estimates and may vary based on experience, location, and industry demand. Based on ERI data; values represent the 10th, Mean, and 90th percentiles.
 Workforce Insights: San Diego, CA Page 2