
Workforce Insights: Phoenix, AZ
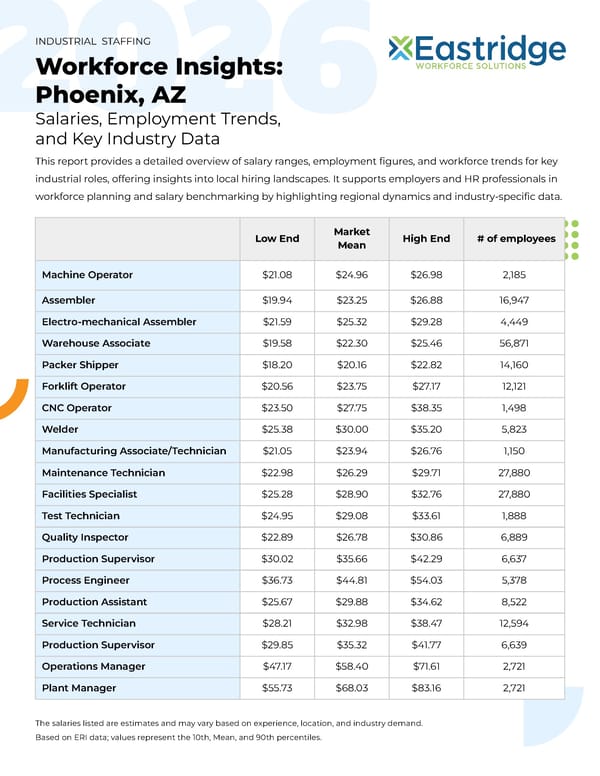
This report provides a detailed overview of salary ranges, employment figures, and workforce trends for key industrial roles in Phoenix, AZ, offering insights into local hiring landscapes.
Low End Market Mean High End # of employees Machine Operator $21.08 $24.96 $26.98 2,185 Assembler $19.94 $23.25 $26.88 16,947 Electro-mechanical Assembler $21.59 $25.32 $29.28 4,449 Warehouse Associate $19.58 $22.30 $25.46 56,871 Packer Shipper $18.20 $20.16 $22.82 14,160 Forklift Operator $20.56 $23.75 $27.17 12,121 CNC Operator $23.50 $27.75 $38.35 1,498 Welder $25.38 $30.00 $35.20 5,823 Manufacturing Associate/Technician $21.05 $23.94 $26.76 1,150 Maintenance Technician $22.98 $26.29 $29.71 27,880 Facilities Specialist $25.28 $28.90 $32.76 27,880 Test Technician $24.95 $29.08 $33.61 1,888 Quality Inspector $22.89 $26.78 $30.86 6,889 Production Supervisor $30.02 $35.66 $42.29 6,637 Process Engineer $36.73 $44.81 $54.03 5,378 Production Assistant $25.67 $29.88 $34.62 8,522 Service Technician $28.21 $32.98 $38.47 12,594 Production Supervisor $29.85 $35.32 $41.77 6,639 Operations Manager $47.17 $58.40 $71.61 2,721 Plant Manager $55.73 $68.03 $83.16 2,721 The salaries listed are estimates and may vary based on experience, location, and industry demand. Based on ERI data; values represent the 10th, Mean, and 90th percentiles. This report provides a detailed overview of salary ranges, employment figures, and workforce trends for key industrial roles, offering insights into local hiring landscapes. It supports employers and HR professionals in workforce planning and salary benchmarking by highlighting regional dynamics and industry-specific data. INDUSTRIAL STAFFING Workforce Insights: Phoenix, AZ Salaries, Employment Trends, and Key Industry Data
 Workforce Insights: Phoenix, AZ Page 2